


01 March 2018
|
 Graphs on changing marriage figures 1935-2015
Find out how the age at marriage and number of marriages have changed from 1935 through to 2015, as Office for National Statistics releases its latest marriage data, for 2015.
Find out how the age at marriage and number of marriages have changed from 1935 through to 2015, as Office for National Statistics releases its latest marriage data, for 2015.
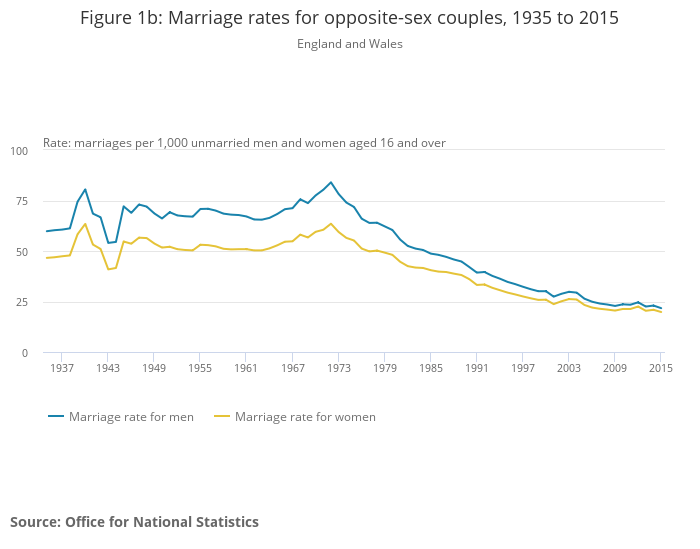
Marriage rates for opposite sex couples were found to be the lowest on record in 2015, with 21.7 marriages per thousand unmarried men and 19.8 marriages per thousand unmarried women.
Follow us on facebook
Follow us on twitter
Sign up for our free e-newsletter
Discover Family Tree magazine
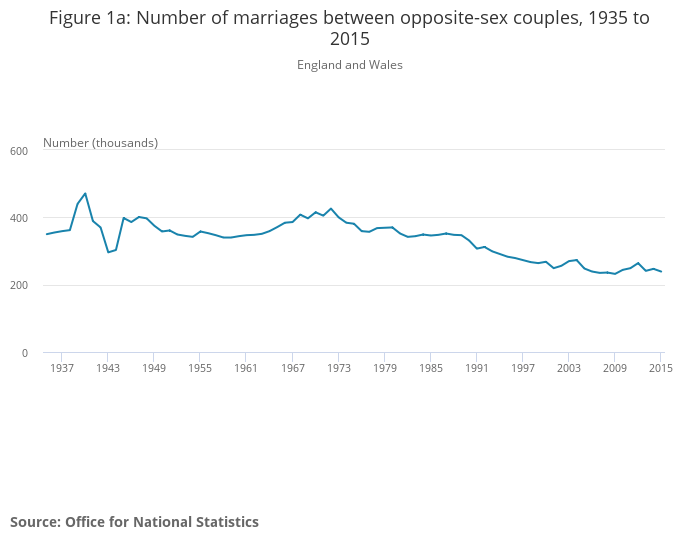
There were 239,020 marriages between opposite-sex couples in 2015, a decrease of 3.4% from 2014 when there 247,372 marriages, and 0.8% lower than in 2013. In 2015 there were 6,493 marriages between same-sex couples, 56% were between female couples; a further 9,156 same-sex couples converted their civil partnership into a marriage.
Number of marriages between opposite sex couples, 1935-2015
Marriage rates for opposite-sex couples, 1935-2015
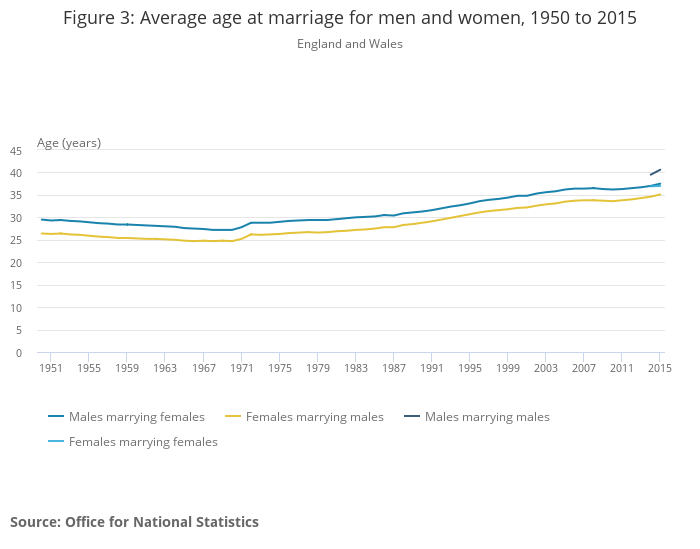
Average age at marriage for men and women, 1950-2015
To see the full statistics visit the Office for National Statistics website.
(photo copyright Amy Quinn)